Progressive waves were simulated for some of the combinations of parameters used in chapter 7. Figures 8-1 - 8-10
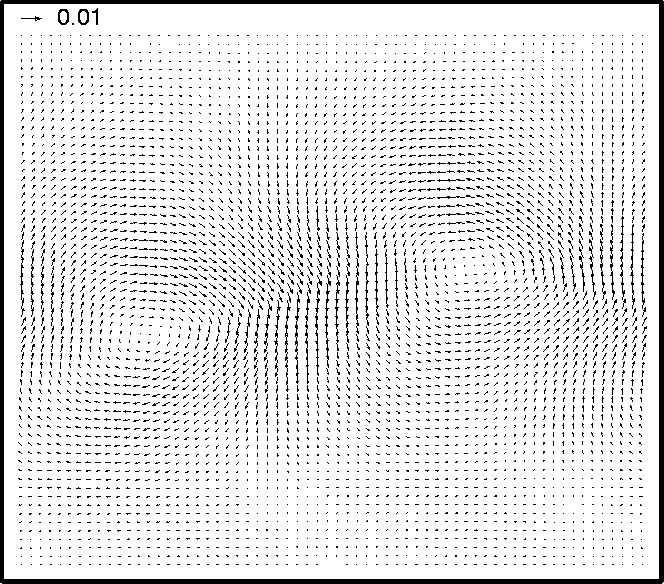
Figure 8-1: Velocity vector plot at ![]() of an interfacial progressive
wave
on a 256 by 256 grid with
of an interfacial progressive
wave
on a 256 by 256 grid with
![]() ,
, ![]() and
and ![]() .
.
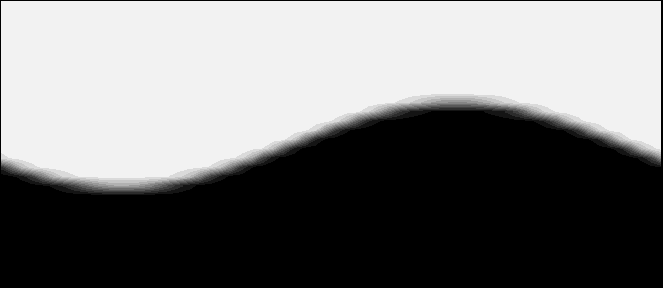
Figure 8-2: The order parameter at ![]() of an interfacial progressive
wave
on a 256 by 256 grid with
of an interfacial progressive
wave
on a 256 by 256 grid with
![]() ,
, ![]() and
and ![]() .
Only halve the grid, centred
on the interface, is shown.
.
Only halve the grid, centred
on the interface, is shown.
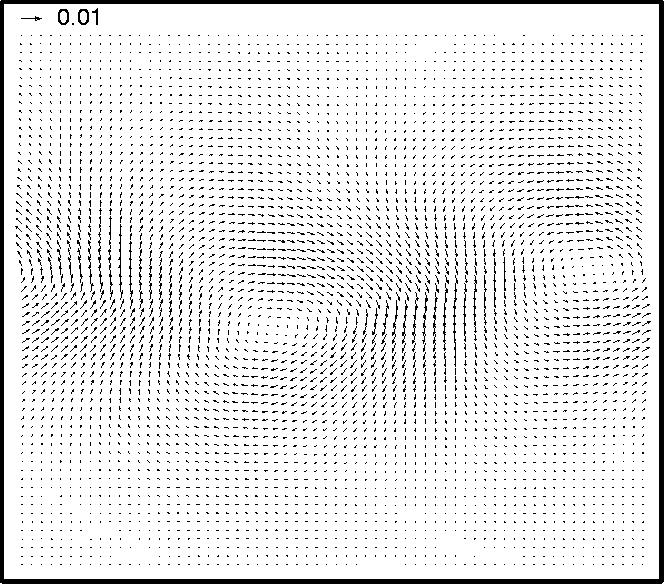
Figure 8-3: Velocity vector plot at ![]() of an interfacial progressive
on a 256 by 256 grid with
of an interfacial progressive
on a 256 by 256 grid with
![]() ,
, ![]() and
and ![]() .
.
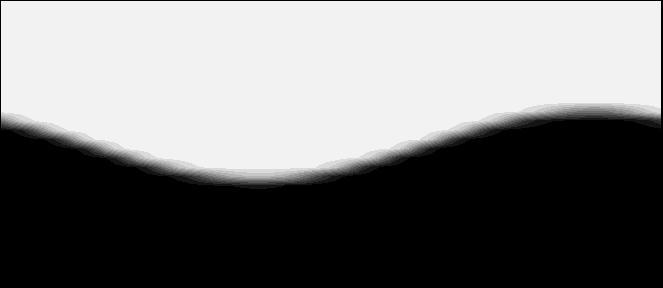
Figure 8-4: The order parameter at ![]() of an interfacial progressive
wave
on a 256 by 256 grid with
of an interfacial progressive
wave
on a 256 by 256 grid with
![]() ,
, ![]() and
and ![]() .
Only halve the grid, centred
on the interface, is shown.
.
Only halve the grid, centred
on the interface, is shown.
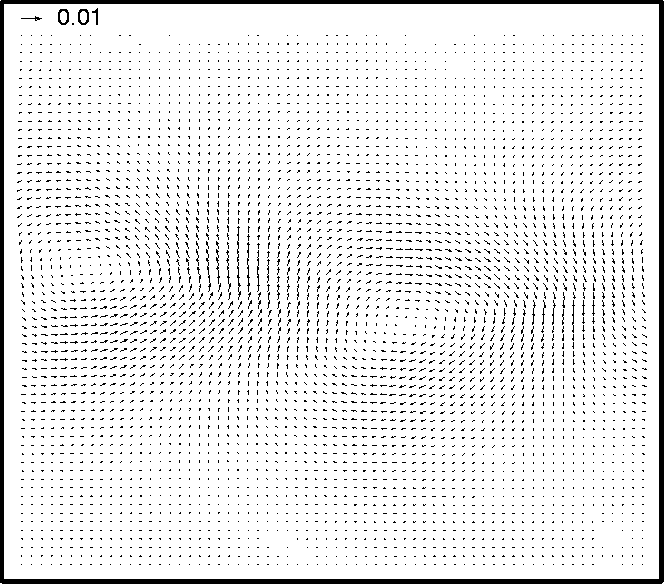
Figure 8-5: Velocity vector plot at ![]() of an interfacial progressive
wave
on a 256 by 256 grid with
of an interfacial progressive
wave
on a 256 by 256 grid with
![]() ,
, ![]() and
and ![]() .
.
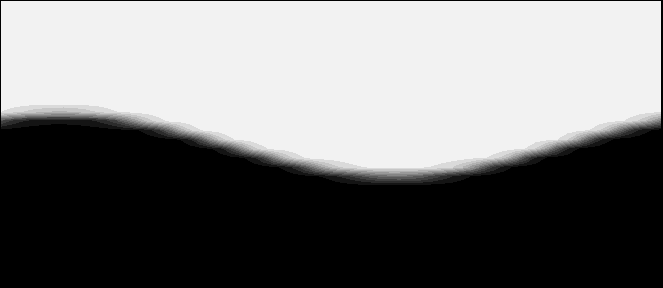
Figure 8-6: The order parameter at ![]() of an interfacial progressive
wave
on a 256 by 256 grid with
of an interfacial progressive
wave
on a 256 by 256 grid with
![]() ,
, ![]() and
and ![]() .
Only halve the grid, centred
on the interface, is shown.
.
Only halve the grid, centred
on the interface, is shown.
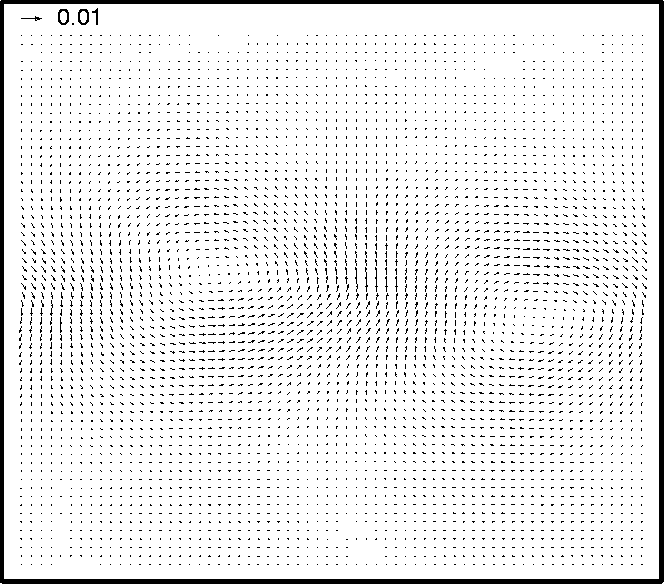
Figure 8-7: Velocity vector plot at ![]() of an interfacial progressive
wave
on a 256 by 256 grid with
of an interfacial progressive
wave
on a 256 by 256 grid with
![]() ,
, ![]() and
and ![]() .
.
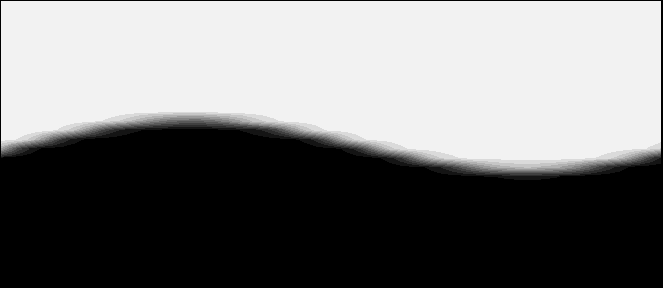
Figure 8-8: The order parameter at ![]() of an interfacial progressive
wave
on a 256 by 256 grid with
of an interfacial progressive
wave
on a 256 by 256 grid with
![]() ,
, ![]() and
and ![]() .
Only halve the grid, centred
on the interface, is shown.
.
Only halve the grid, centred
on the interface, is shown.
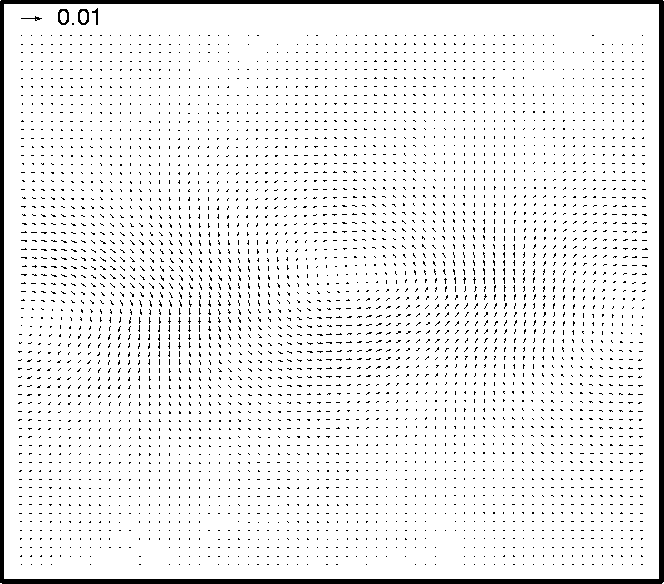
Figure 8-9: Velocity vector plot at ![]() of an interfacial progressive
wave
on a 256 by 256 grid with
of an interfacial progressive
wave
on a 256 by 256 grid with
![]() ,
, ![]() and
and ![]() .
.
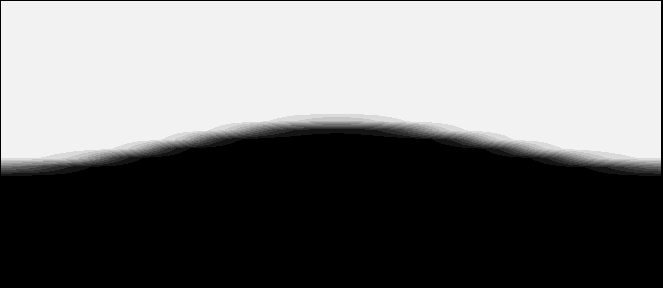
Figure 8-10: The order parameter at ![]() of an interfacial progressive
wave
on a 256 by 256 grid with
of an interfacial progressive
wave
on a 256 by 256 grid with
![]() ,
, ![]() and
and ![]() .
Only halve the grid, centred
on the interface, is shown.
.
Only halve the grid, centred
on the interface, is shown.
show a progressive wave on a 256 by 256 site grid. The parameters used
are ![]() ,
, ![]() and
and ![]() .
The difference between the interface shown here where
.
The difference between the interface shown here where ![]() and the interface of the standing waves shown in, for example
figure 7-3,
where
and the interface of the standing waves shown in, for example
figure 7-3,
where ![]() can be seen. Here there is a definite region around
the interface where there is a mixture of the two fluids. This can be see
in figures 8-1 - 8-10 as the grey region
around the interface. This region is not there in figure 7-3
where the interface is much sharper.
can be seen. Here there is a definite region around
the interface where there is a mixture of the two fluids. This can be see
in figures 8-1 - 8-10 as the grey region
around the interface. This region is not there in figure 7-3
where the interface is much sharper.