All the results show good agreement with each other. Figure 5-5
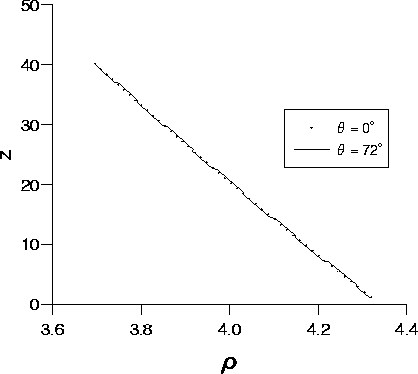
Figure 5-5: The equilibrium density as a function of height when ![]() (points) and
(points) and ![]() (line).
(line).
shows the results for two angles, ![]() and
and ![]() when gravity is implemented using method (2). The results for
when gravity is implemented using method (2). The results for ![]() are seen to lie on either side of the results for
are seen to lie on either side of the results for
![]() The cross over between these
lines corresponds to the points, shown in figure 5-4, moving from
one side of the solid line to the other. This effect was also noticed on the
other results for smaller
The cross over between these
lines corresponds to the points, shown in figure 5-4, moving from
one side of the solid line to the other. This effect was also noticed on the
other results for smaller ![]() but to a lesser extent. There is also a
small error introduced because the point P is not exactly on the boundary.
Clearly these errors are relatively small, all the
results lie within one lattice unit of each other.
A closer comparison can be made between the results for
but to a lesser extent. There is also a
small error introduced because the point P is not exactly on the boundary.
Clearly these errors are relatively small, all the
results lie within one lattice unit of each other.
A closer comparison can be made between the results for ![]() and
and
![]() because the exact height above the boundary is know. To do
this the results for
because the exact height above the boundary is know. To do
this the results for ![]() were linearly interpolated to find the
density at integer lattice-step separations. These were then compared to the
results for
were linearly interpolated to find the
density at integer lattice-step separations. These were then compared to the
results for ![]() and their difference
and their difference ![]() is plotted
in figure 5-6.
is plotted
in figure 5-6.
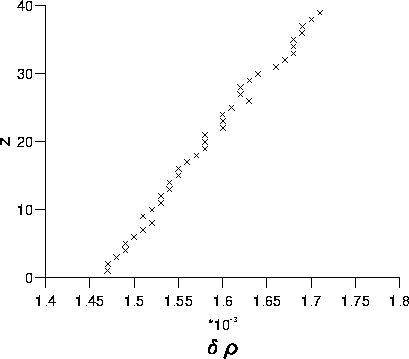
Figure 5-6: The equilibrium density difference ![]() between the
results for
between the
results for ![]() and
and ![]() as a function of
height.
as a function of
height.
The difference between the results is always less than 0.04%, the difference
depending on the height above the boundary. This is probably due to the
box not being exactly square, its dimensions are 40 by ![]() lu which is 40 by 39.8 lu, a difference of 0.5%.
lu which is 40 by 39.8 lu, a difference of 0.5%.